2022–2023 Cycle 6 EDI Results
Since 2004, The Early Development Instrument (EDI) has been implemented throughout the province of Ontario. Cycle 6 was completed during the 2022–2023 school year. Senior Kindergarten (SK) teachers from the following school boards in Windsor and Essex County completed EDIs on each of their students:
- The Greater Essex County District School Board (GECDSB)
- The Windsor-Essex Catholic District School Board (WECDSB)
- Conseil Scolaire Catholique Providence (CSC Providence)
- Conseil Scolaire Viamonde (CS Viamonde)
Windsor-Essex Group Reports
Researchers at the Offord Centre for Child Studies at McMaster University provided the following group reports for all Windsor-Essex County SK children who had valid EDIs and were not identified as having special needs:
2022–2023 Offord Centre Reports for Windsor-Essex
Windsor-Essex County: 2022/2023 EDI Results
Lowest 10% based on the Ontario baseline cut-offs

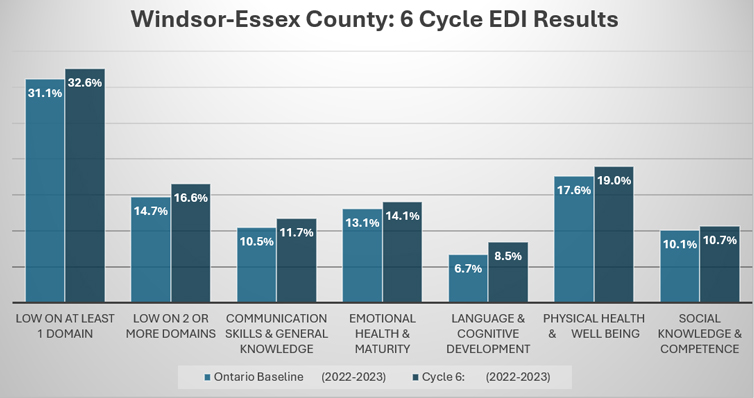
The "Windsor-Essex County Six Cycle EDI Results Graph" seen above presents a comparison of early childhood development indicators between Windsor-Essex County (Cycle 6: 2022–2023) and the Ontario baseline. The data is visualized through percentages across several developmental domains.
Here’s a summary of the key data:
Developmental Vulnerability (Low Scores)
- Low on at least 1 Domain:
- Windsor-Essex: 32.6%
- Ontario Baseline: 31.1%
- Low on 2 or more Domains:
- Windsor-Essex: 16.6%
- Ontario Baseline: 14.7%
EDI Domains (Early Development Instrument)
- Physical Health & Well-being:
- Windsor-Essex: 19.0%
- Ontario: 17.6%
- Social Knowledge & Competence:
- Windsor-Essex: 10.7%
- Ontario: 10.1%
- Emotional Health & Maturity:
- Windsor-Essex: 14.1%
- Ontario: 13.1%
- Language & Cognitive Development:
- Windsor-Essex: 8.5%
- Ontario: 6.7%
- Communication Skills & General Knowledge:
- Windsor-Essex: 11.7%
- Ontario: 10.5%
Insights
- Windsor-Essex shows slightly higher vulnerability across all domains compared to the Ontario baseline.
- The largest gaps are in Emotional Health & Maturity and Language & Cognitive Development.
Neighbourhood Reports
More detailed neighbourhood-level reports are provided by the local Data Analysis Coordinator for Windsor-Essex. Results were mapped by postal code, and students were assigned to large “Best Start” for planning purposes.
Percentage Maps for the following EDI results:
The following maps illustrates the geographic distribution of children who shown as vulnerable in Cycle 6 (2022-2023) Early Development Instrument (EDI), across Windsor-Essex Best Start Neighourhoods.
Developmental Vulnerability (Low Scores)
Low on at least 1 Domain: MapKey Highlights:
- Overall Performance:
- Windsor-Essex: 32.6% of students scored in the lowest decile.
- Ontario average: 31.1% indication Windsor-Essex is slightly above the provincial average.
- Neighbourhood-Level Data:
- Highest percentages: West Windsor (45%), Leamington (44%) and Central (42%).
- Lowest percentages: Sandwich South & Industrial Zone (0%), Tecumseh (22%) and Amherstburg (24%).
Key Highlights:
- Overall Performance:
- Windsor-Essex: 16.6% of students scored in the lowest decile.
- Ontario average: 14.7% indication Windsor-Essex is slightly above the provincial average.
- Neighbourhood-Level Data:
- Highest percentages: Leamington (28%), West Windsor (26%) and Central (23%)
- Lowest percentages: Sandwich South & Industrial Zone (0%), Kingsville (9%) and Tecumseh (13%)
EDI Domains (Early Development Instrument)
Physical Health and Well-Being: MapKey Highlights:
- Overall Performance:
- Windsor-Essex: 19.0% of students scored in the lowest decile.
- Ontario average: 17.5% indication Windsor-Essex is slightly above the provincial average.
- Neighbourhood-Level Data:
- Highest percentages: Leamington (30%), West Windsor (32%) and Central (23%).
- Lowest percentages: Sandwich South & Industrial Zone (0%), Kingsville (9%) and Tecumseh (13%).
Key Highlights:
- Overall Performance:
- Windsor-Essex: 10.7% of students scored in the lowest decile.
- Ontario average: 10.1% indication Windsor-Essex is slightly above the provincial average.
- Neighbourhood-Level Data:
- Highest percentages: Leamington (18%), West Windsor (15%), Central South and Forest Glade/Riverside (13%).
- Lowest percentages: Sandwich South & Industrial Zone (0%), South Windsor (8%) with Kingsville and Lakeshore (8%).
Key Highlights:
- Overall Performance:
- Windsor-Essex: 14.1% of students scored in the lowest decile.
- Ontario average: 13.1% indication Windsor-Essex is slightly above the provincial average.
- Neighbourhood-Level Data:
- Highest percentages: Central (21%), West Windsor (20%) and Forest Glade/Riverside (16%).
- Lowest percentages: Sandwich South & Industrial Zone (0%), Central South (9%) and Lakeshore (10%).
Key Highlights:
- Overall Performance:
- Windsor-Essex: 8.5% of students scored in the lowest decile.
- Ontario average: 6.7% indication Windsor-Essex is slightly above the provincial average.
- Neighbourhood-Level Data:
- Highest percentages: Central South, Leamington and West Windsor (15%), Central (13%) and Forest Glade/Riverside (10%).
- Lowest percentages: Sandwich South & Industrial Zone (0%), Tecumseh (3%) with Essex and LaSalle (4%).
Key Highlights:
- Overall Performance:
- Windsor-Essex: 11.7% of students scored in the lowest decile.
- Ontario average: 10.5% indication Windsor-Essex is slightly above the provincial average.
- Neighbourhood-Level Data:
- Highest percentages: Leamington (21%), West Windsor (19%) and Central (17%).
- Lowest percentages: Sandwich South & Industrial Zone (0%), Kingsville (5%) with Amherstburg, Essex and LaSalle (6%).
