Historical Energy Data
Energy management starts with a clear understanding of how and when energy is used. The scope of this analysis is limited to energy use of electricity, natural gas, water, and district heating and cooling within the City’s building portfolio, including streetlights. By reviewing data from 2014 to 2023, the City can see how usage has changed over time and identify opportunities to improve efficiency moving forward.
Electricity Historical Utility Use Data
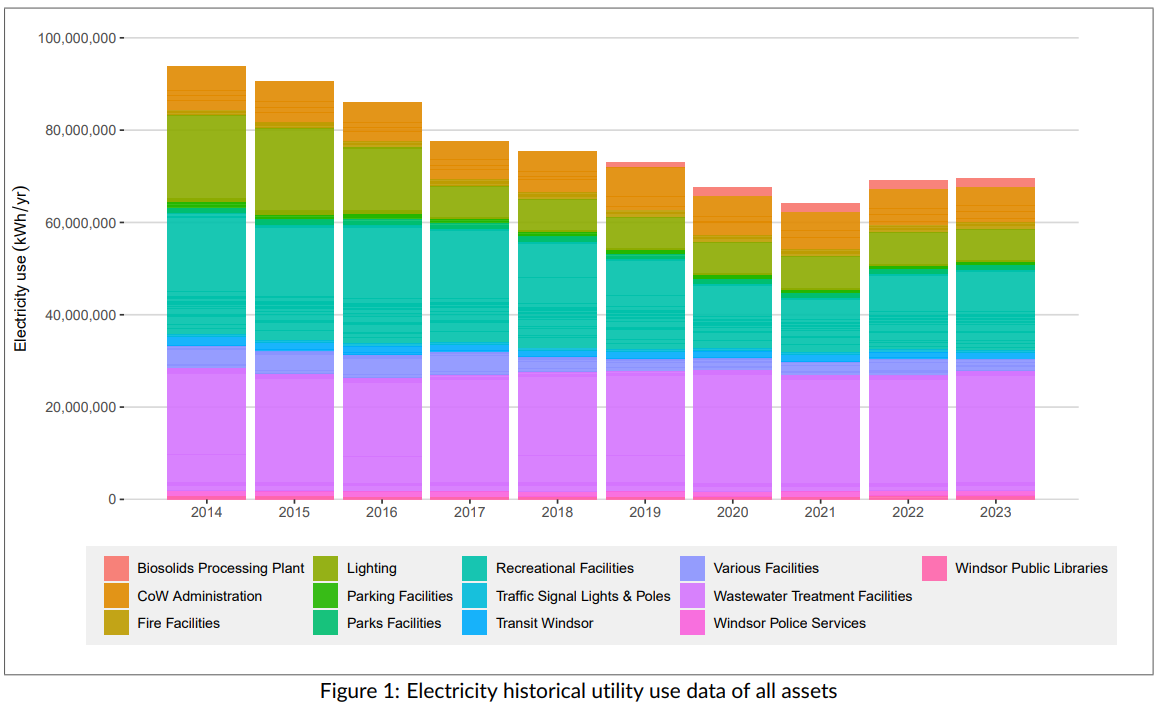
From 2014 to 2023, the City of Windsor achieved a 26% reduction in electricity consumption across all municipal assets. The lower electricity use in 2020 and 2021 was largely reduced operations due to the COVID-19 pandemic, and the increase came as these facilities returned to normal operations. Despite recent increases, the long-term trend shows significant progress in energy conservation.
Natural Gas Historical Utility Use Data
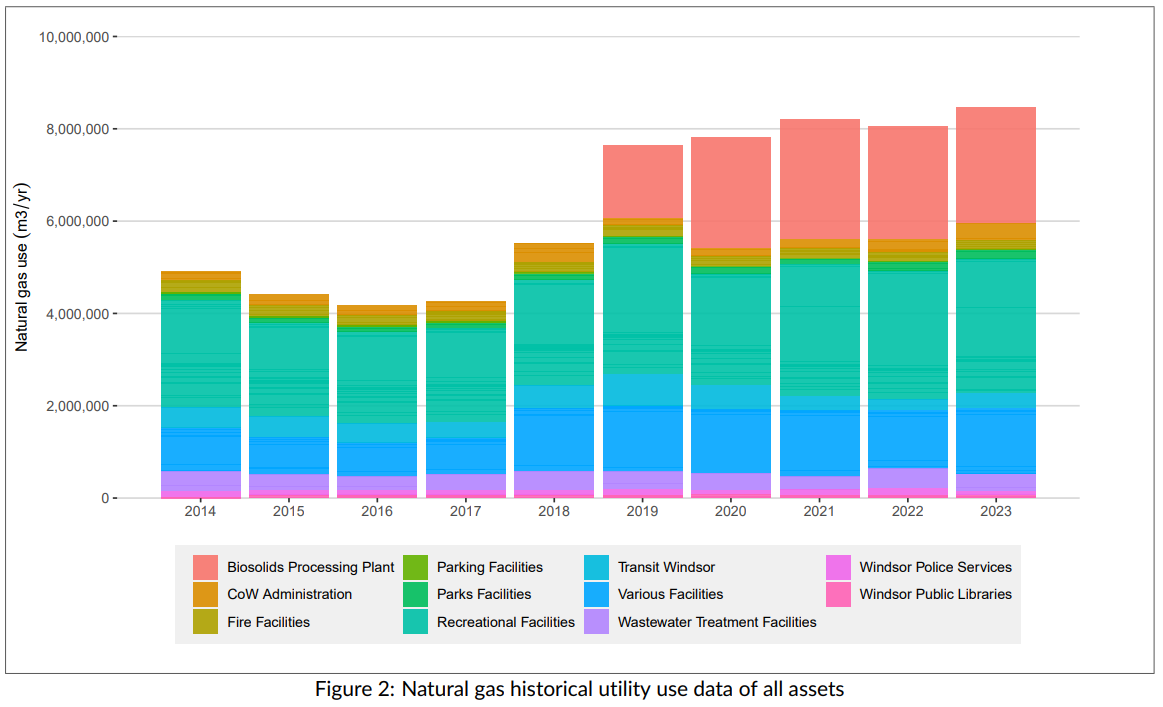
From 2014 to 2016, the City of Windsor's natural gas consumption slightly decreased, followed by an increase in 2019. This increase is mainly due to the City of Windsor acquiring the Windsor Biosolids Processing Facility in 2019, as this facility consumes a significant portion of the City's natural gas. Additional factors include the acquisition of additional assets like the Paul Martin Building and the implementation of combined-heat-and- power (CHP) systems. Although energy-saving measures from the 2019–2023 Corporate Energy Management Plan have reduced consumption at these facilities, the overall usage has grown due to the new acquisitions.
Heated Water Historical Utility Use Data
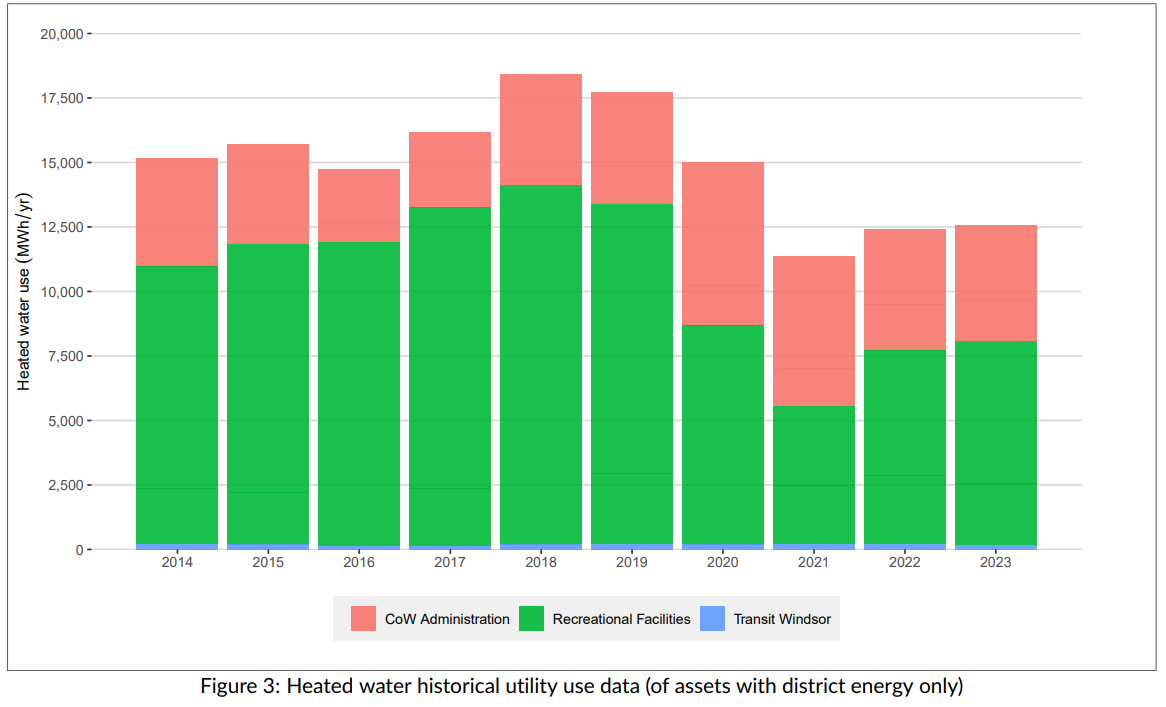
Some City of Windsor facilities use a district energy system that supplies heated and chilled water for temperature control. From 2014 to 2023, heated water usage at these facilities remained fairly consistent. However, usage at indoor aquatic facilities dropped between 2019 and 2020, likely due to the COVID-19 pandemic. Even after most facilities resumed normal operations in 2022 and 2023, heated water consumption stayed below pre-pandemic levels, which suggests operational improvements were made to reduce heated water use. The installation of combined-heat-and- power (CHP) systems at recreation facilities helped reduce their heated water demand.
Chilled Water Historical Utility Use Data
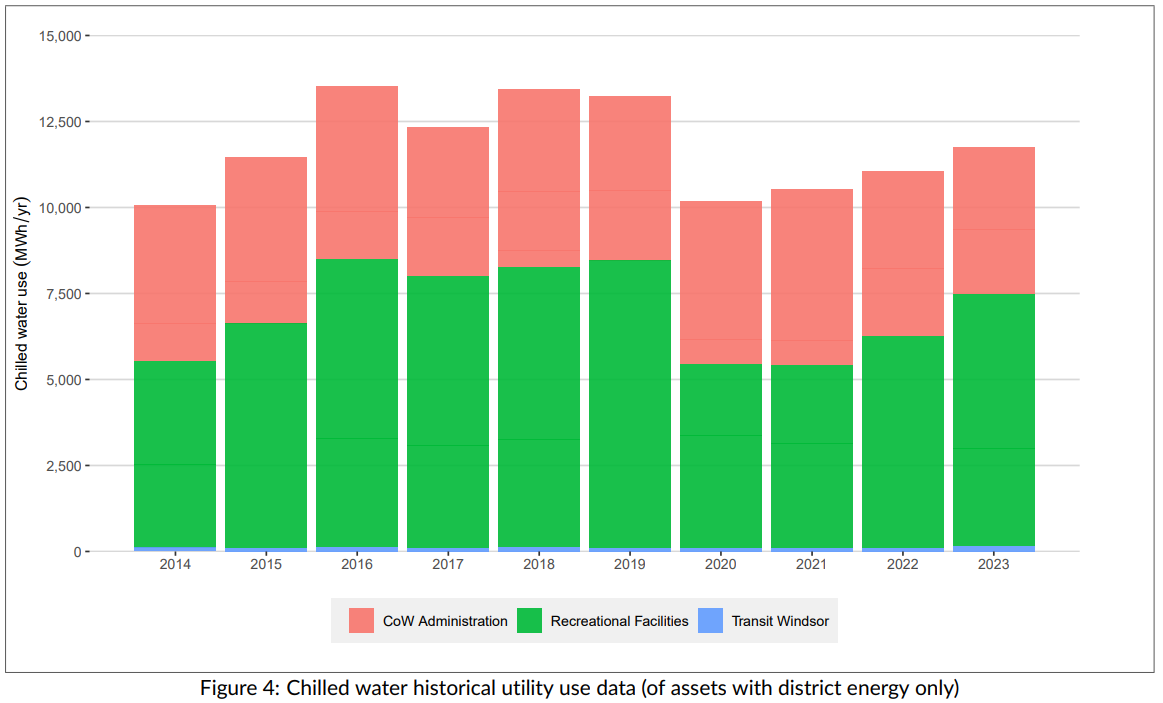
Some City of Windsor facilities are cooled using a district energy system that supplies chilled water. From 2014 to 2023, chilled water usage at these facilities remained relatively stable. However, usage at indoor aquatic facilities declined between 2019 and 2020, likely due to the COVID-19 pandemic. Even after most facilities resumed normal operations in 2022 and 2023, chilled water consumption remained below pre-pandemic levels, suggesting that operational improvements to reduce chilled water usage.
Historical Energy Use Data
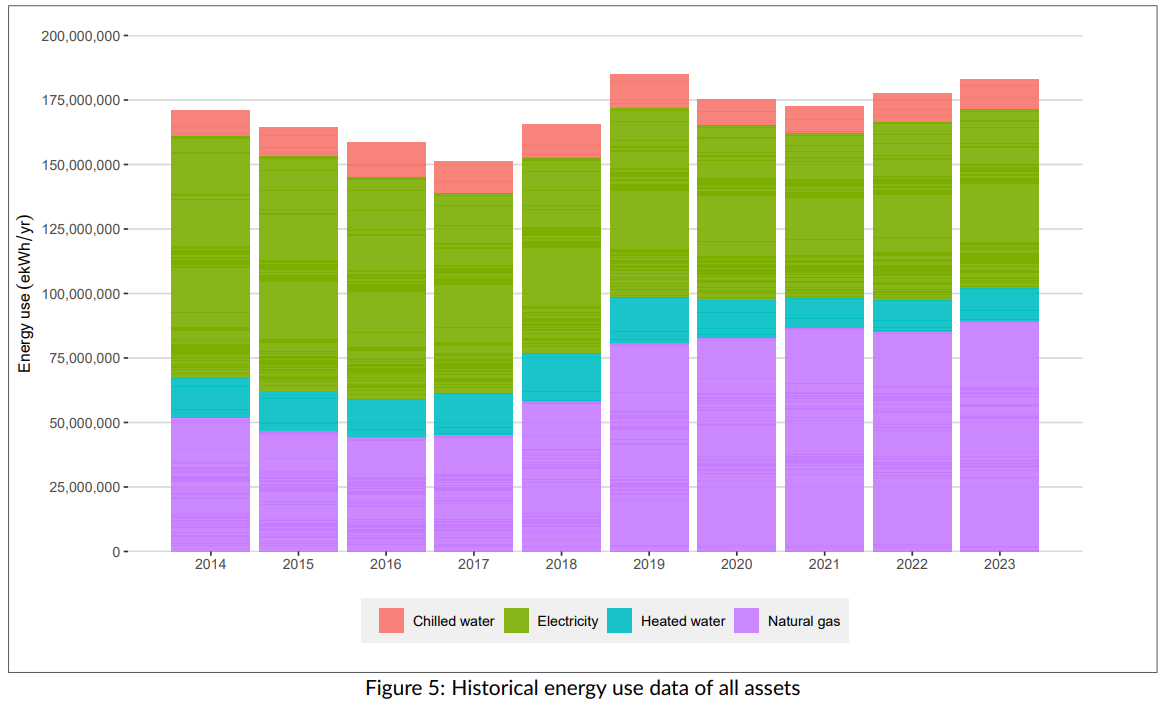
Based on trends identified in the City’s utility use, energy use decreased from 2014 to 2017, increased from 2017 to 2019, and has largely remained consistent since then.
Historical Utility Cost Data
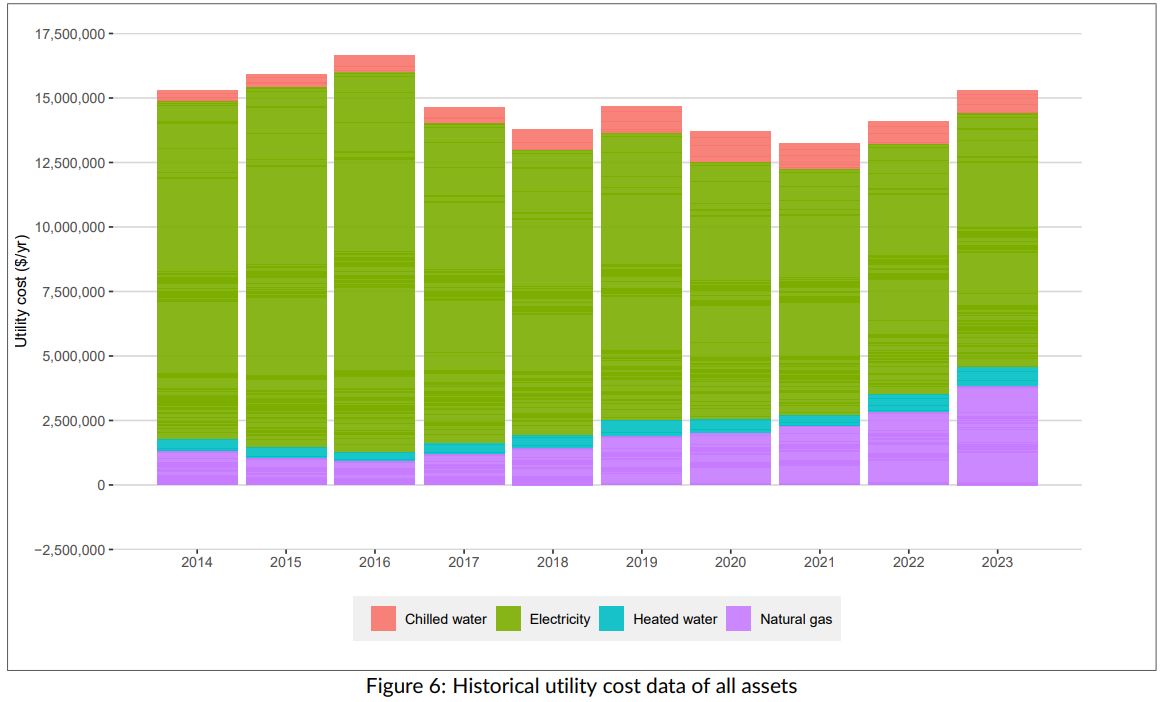
Electricity generation in Ontario is managed by the Independent Electricity System Operator (IESO) through a deregulated market, allowing generators to bid into an open system. This results in fluctuating electricity prices, influenced by the Hourly Ontario Energy Price (HOEP) and the Global Adjustment (GA), both of which are highly volatile. From 2014 to 2023, the average effective electricity price rose from 9.1 to 10.4 cents per kWh, peaking at 13.2 cents in 2020, with significant monthly variations.
Despite rising electricity and natural gas costs, the City of Windsor's overall utility expenses decreased from 2014 to 2021 due to reduced electricity consumption, which historically made up the bulk of utility costs. Ontario’s electricity grid uses diverse sources — nuclear, hydro, wind, solar, and fossil fuels — and shifts in demand and decarbonization efforts affect both generation costs and emissions.
The federal carbon charge, introduced in 2019 and set to reach $170 per tonne of carbon dioxide equivalent (CO₂e) by 2030, has increased the cost of natural gas and will continue to do so. To stabilize costs, the City has a net-metering agreement with ENWIN Utilities and the IESO, allowing it to offset utility expenses using renewable energy. Future energy options, like hydrogen, may help reduce fossil fuel use and carbon tax impacts. While combined-heat-and- power (CHP) systems have played a role in energy strategy, current economic and political conditions may lead to their phase-out due to reduced net benefits.
Greenhouse Gas (GHG) Emissions Historical Trends
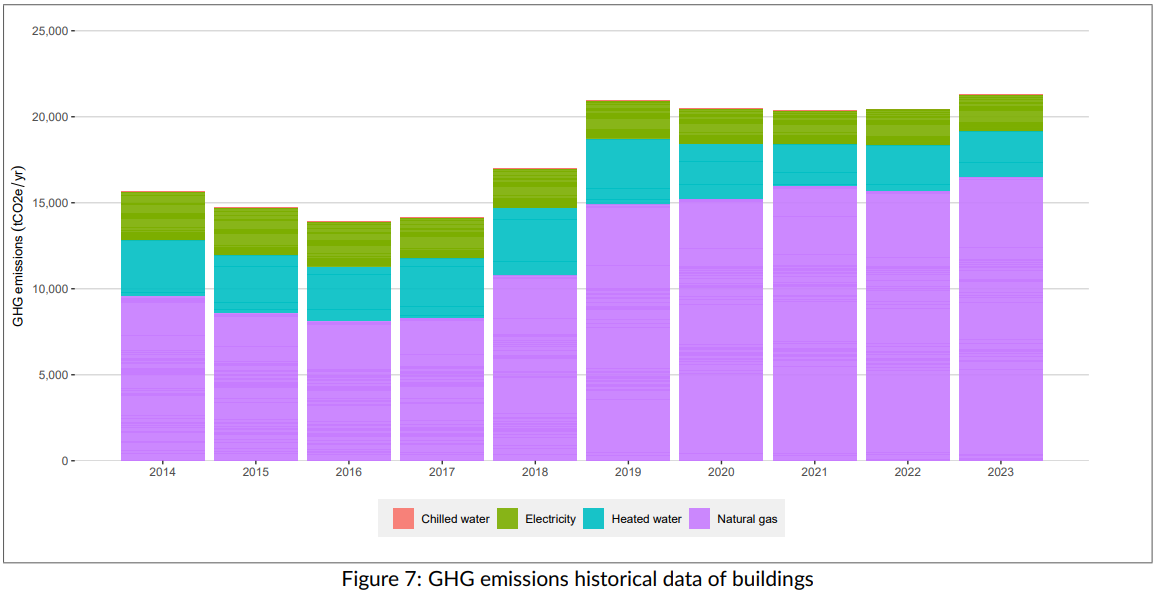
GHG emissions largely follow the same trends as the energy-use data. However, it is important to note that emissions factors play a significant role in the variance observed across energy sources. For example, natural gas and heated water have higher emissions factors than electricity and chilled water. The City's overall GHG emissions were gradually decreasing from 2014 to 2017, although with the acquisition of the Windsor Biosolids Processing Facility in 2019, there was a large increase in GHG emissions, which maintained higher emissions until 2023.
Asset Planning and Energy Initiatives Unit
For general information and detailed inquiries, call 311.
