Windsor Greenhouse Gas Emissions
The City of Windsor’s greenhouse gas (GHG) inventory is divided into two overarching categories: “Community”, which refers to the aggregate emissions of all sectors operating within Windsor; and “Corporate,” which pertains solely to emissions generated via the activities of the Corporation of the City of Windsor.
The City of Windsor monitors, tracks, and reports its GHG emissions for several key reasons:
- Tracking progress towards climate goals: The Community Energy Plan (2017) and the Corporate Climate Action Plan (2017) set climate targets for the city to reach by 2041. By regularly updating the GHG inventory, the City can assess the effectiveness of its climate actions and adjust strategies as necessary.
- Participation in national and global initiatives: The City of Windsor is a member of the Federation of Canadian Municipalities’ Partners for Climate Protection (PCP) and the Global Covenant of Mayors (GCoM). Participation in these initiatives strongly encourages cities to report their GHG emissions and demonstrate ongoing climate change mitigation efforts. Fulfilling reporting obligations showcases Windsor’s commitment to climate leadership.
- Understanding environmental impact: The GHG inventory includes emissions from electricity, natural gas, vehicle fuels, and waste disposal. This comprehensive view helps the City understand its environmental footprint and identify high-impact areas for intervention.
- Public transparency and engagement: Publishing the GHG inventory helps keep residents informed and engaged. It builds public trust and encourages community-wide participation in sustainability efforts.
- Informing policy and planning: The inventory provides data that informs local policies, infrastructure planning, and investment decisions.
Once we report on GHG emissions, the Environmental Sustainability & Climate Change Department also compares the community and corporate results against several targets to assess our progress.
Targets used for comparison include the following:
- Community Energy Plan/Corporate Climate Action Plan (2017)
- Science-based target as calculated for Windsor (2023)
- Government of Ontario GHG Emissions Target (2017)
- Government of Canada GHG Emissions Target (2021)
Community Greenhouse Gas Emissions in 2023
Community emissions sources include the residential, commercial, institutional, industrial, transportation, and solid waste sectors.
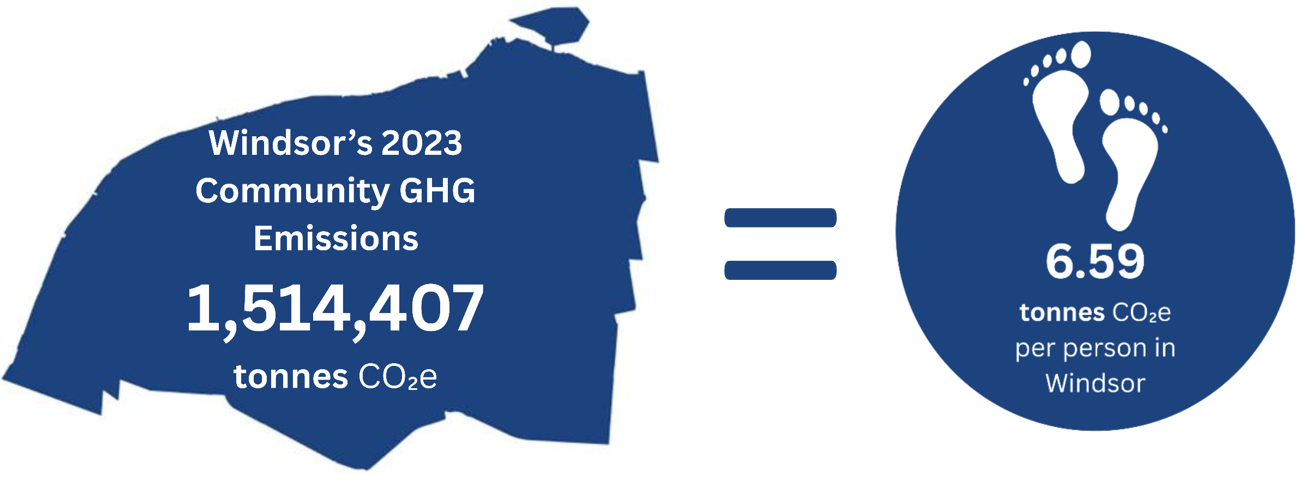
Figure 1, as seen above, shows the community greenhouse gas emissions for 2023 are estimated to have totalled 1.514 million tonnes of carbon dioxide equivalent (tCO2e), or more than 6.59 tonnes per person.
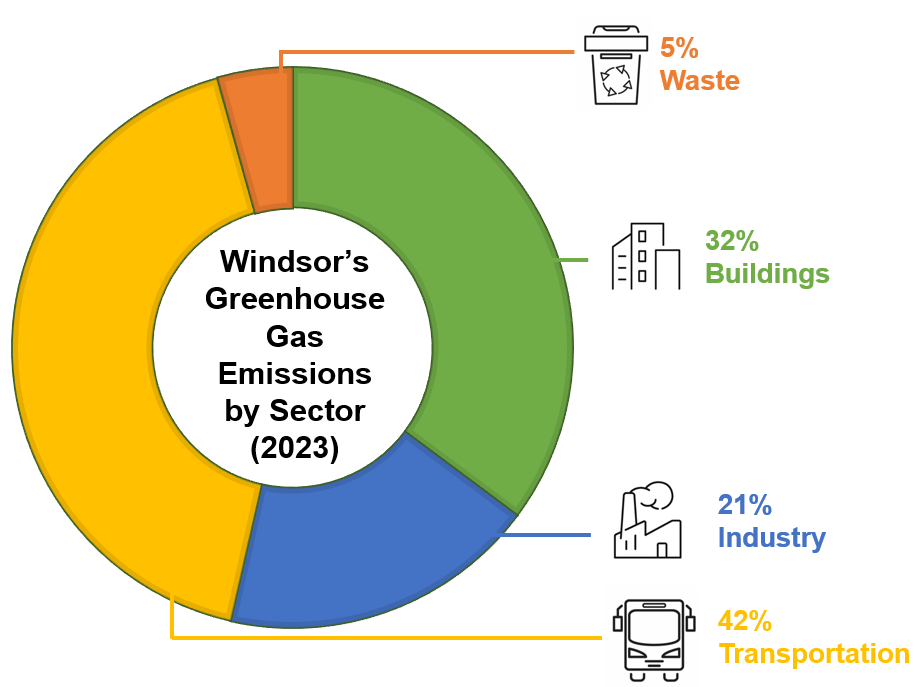
Figure 2, as seen above, represents the breakdown of the overall community-wide emissions by sector for 2023. The transportation sector makes up the majority of Windsor's community's greenhouse gas emissions at 42%, buildings at 32%, industry at 21%, and waste at 5%.
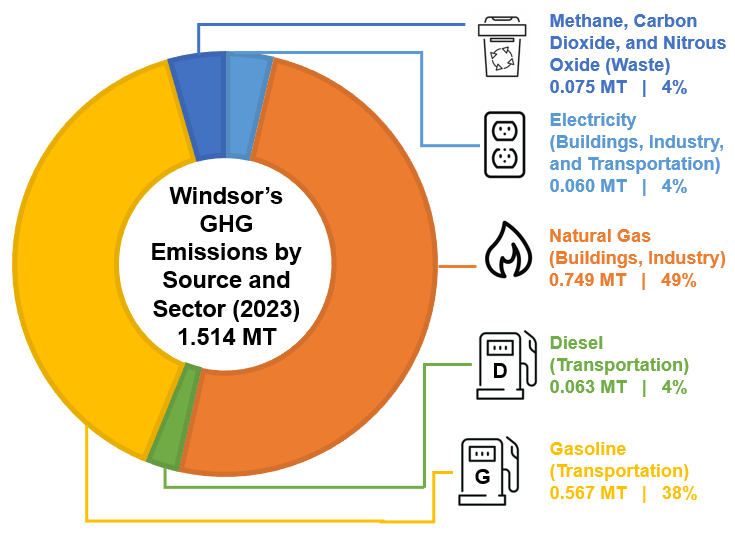
Figure 3, as seen above, shows that natural gas use is the primary cause of greenhouse gas emissions in Windsor. Natural gas use is responsible for 49% of greenhouse gas emissions, while gasoline is the second-largest contributor of GHG emissions, sitting at 38%.
How are community GHG emissions tracking to targets?
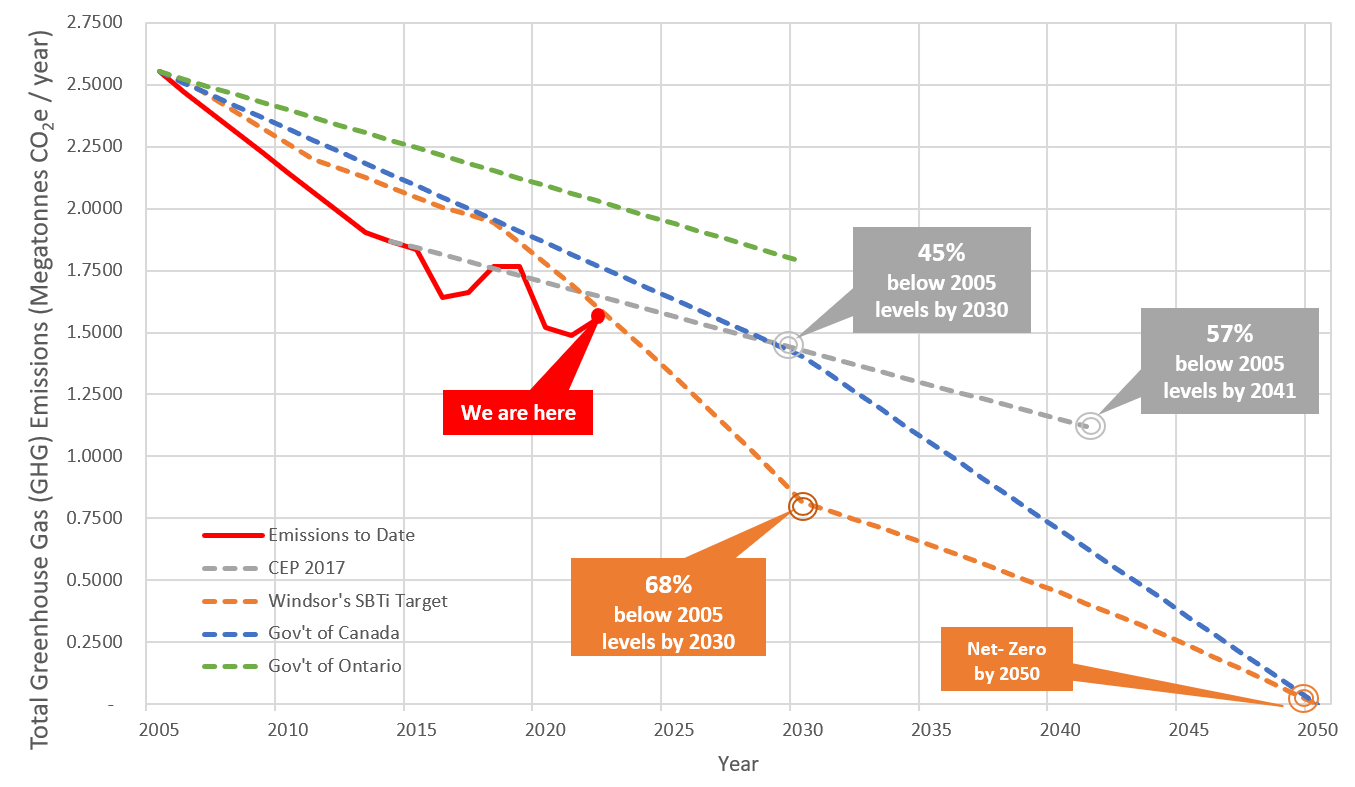
Community-wide emissions have decreased since 2005, and the City exceeded its 2023 emissions reduction target. While future emissions may rise due to growth-related increases, the City remains dedicated to implementing strategies that will continue to mitigate GHG emissions and promote a greener future.
Corporate Greenhouse Gas Emissions
The City of Windsor's municipal GHG emissions account for about 2.7% of community emissions, totals 40,342 tonnes of carbon dioxide equivalent (tCO2e) in 2023.
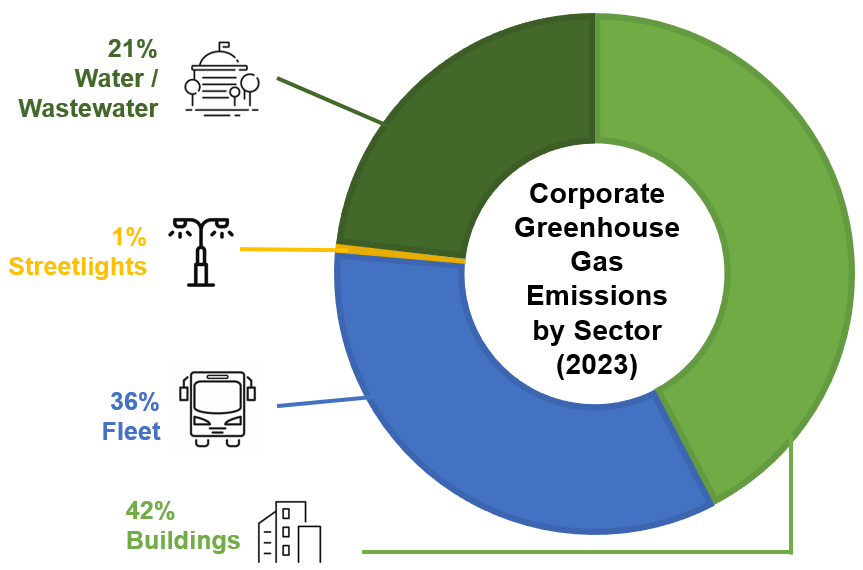
Figure 4, as seen above, highlights the breakdown of emissions from municipal assets. Municipal buildings are responsible for the largest portion of these emissions at 42%, followed by the corporate fleet and transit services at 36%, water and wastewater at 21%, and streetlights at 1%.
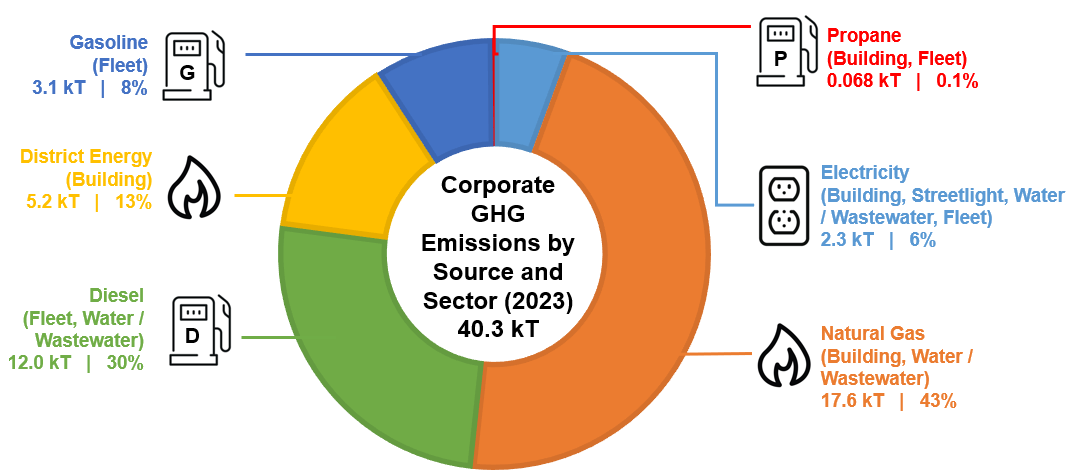
Figure 5, as seen above, shows that natural gas and water heating are the largest contributors of municipal GHG emissions at 56% (natural gas 43% and district energy 13%). Transportation fuels, which include gasoline, diesel, propane and ethanol, make up 38% of municipal GHG emissions.
How are corporate GHG emissions tracking to targets?
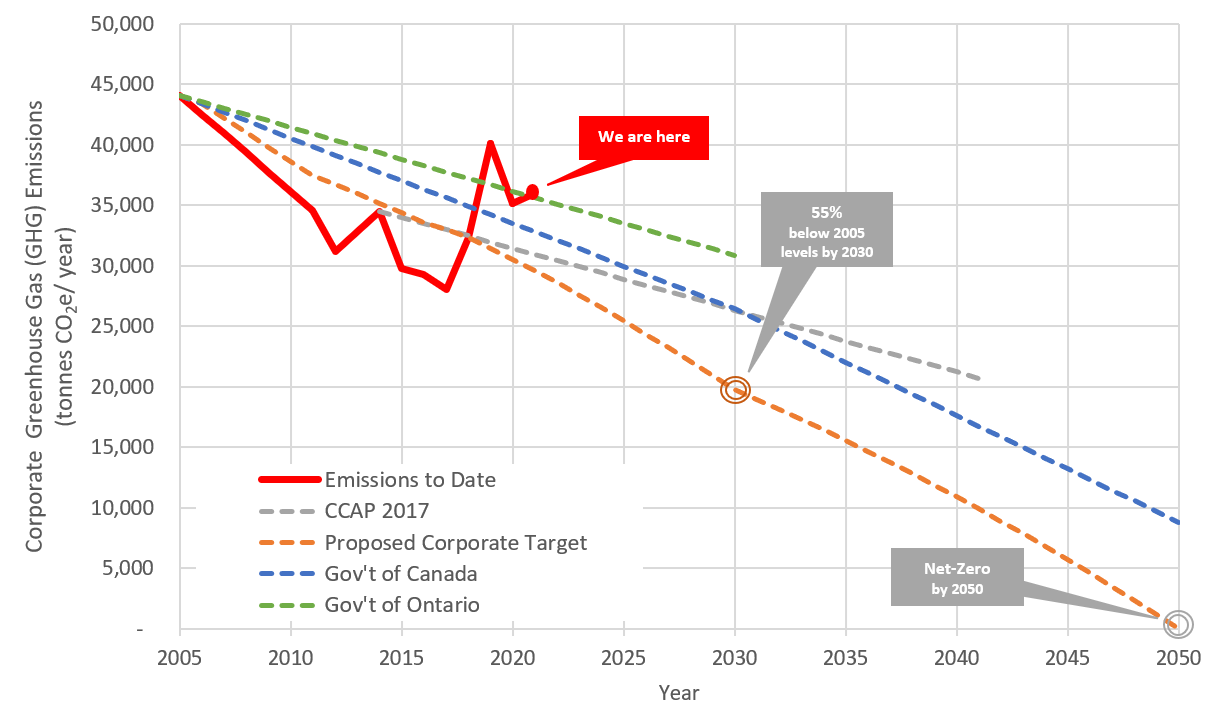
Corporate emissions have decreased since 2005. Since 2017, corporate GHG emissions have increased significantly with the addition of natural gas intensive processes, such as Combined Heat and Power (CHP) units and Windsor Biosolids Plant. While these processes have contributed to higher emissions, they also represent significant advancements in infrastructure and energy production, which are needed to meet growth demands in Windsor.
For more information on greenhouse gas emissions:
For general information, contact 311. For detailed inquiries, call 519-255-6100 ext. 6109.
Email: emp@citywindsor.ca
